(Solved): The life expectancy data for Canada [1] is provided data life-expectancy CAN.xls i) Using tec ...
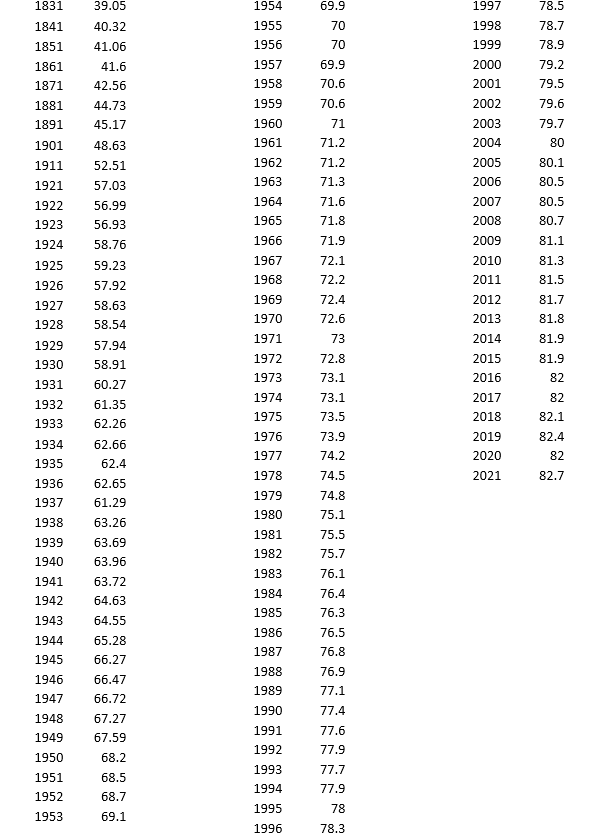
The life expectancy data for Canada [1] is provided “data life-expectancy CAN.xls”
i) Using technology, compute the correlation coefficient between Year of Birth and Life Expectancy. Graph and display the least squares regression equation.
ii) Which variable is the independent variable, and which is the dependent variable.
ii) Using the least squares line find the estimated life expectancy for an individual born in 1982. Does the least squares line give an accurate estimate for that year? Explain why or why not.
iii) Using the least squares line, find the estimated life expectancy for an individual born in 2050. Does the least squares line give an accurate estimate for that year? Explain why or why not.
iv) What is the slope of the least-squares (best-fit) line? Interpret the slope
Expert Answer
SOLUTION:- i) To compute the correlation coefficient between Year of Birth and Life Expectancy, we can use a statistical