Home /
Expert Answers /
Economics /
the-money-market-in-the-united-states-and-the-investment-demand-curve-are-as-shown-in-the-graphs-bel-pa930
(Solved): The money market in the United States and the investment demand curve are as shown in the graphs bel ...
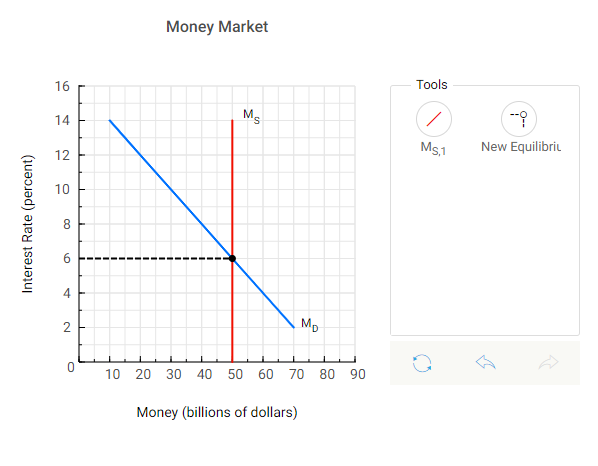
The money market in the United States and the investment demand curve are as shown in the graphs below. Currently, the Federal Reserve has a money supply of $50 billion and the money market is in equilibrium.
a. Suppose the Federal Reserve decreases the money supply by $10 billion. Use the money market and investment demand graphs to show the effects of the decrease in the money supply on interest rates, money demand, and investment.
Instructions: In the money market graph, use the tool provided "MS,1" to draw a new money supply curve. Plot only the endpoints of the line (2 points total). Use the tool provided "New Equilibrium" to plot a new equilibrium interest rate.
Money Market