Home /
Expert Answers /
Electrical Engineering /
the-one-line-diagram-of-a-power-grid-is-depicted-by-fig-1-the-data-for-the-grid-are-g-pa500
(Solved): The one-line diagram of a power grid is depicted by Fig. 1. The data for the grid are g ...
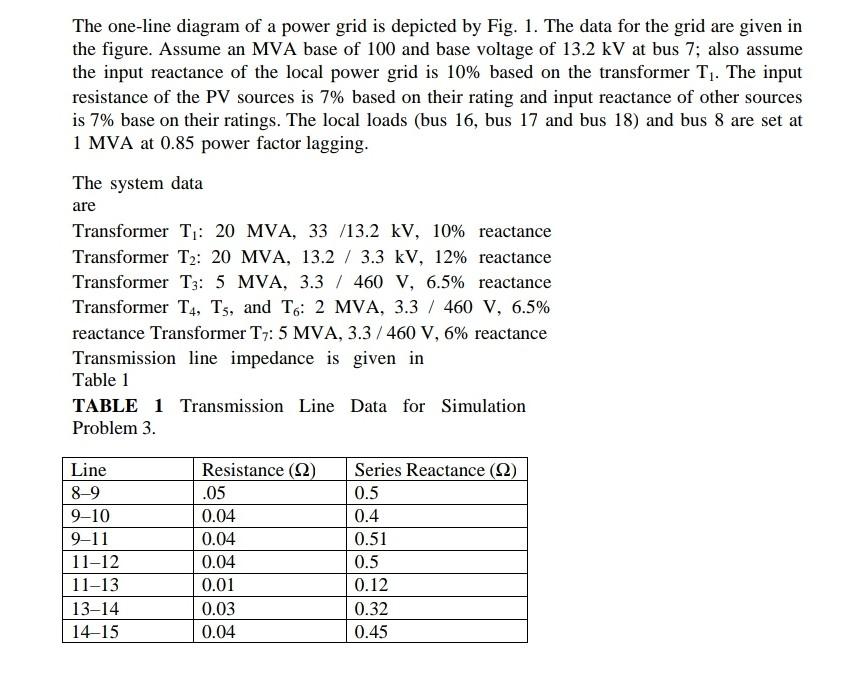
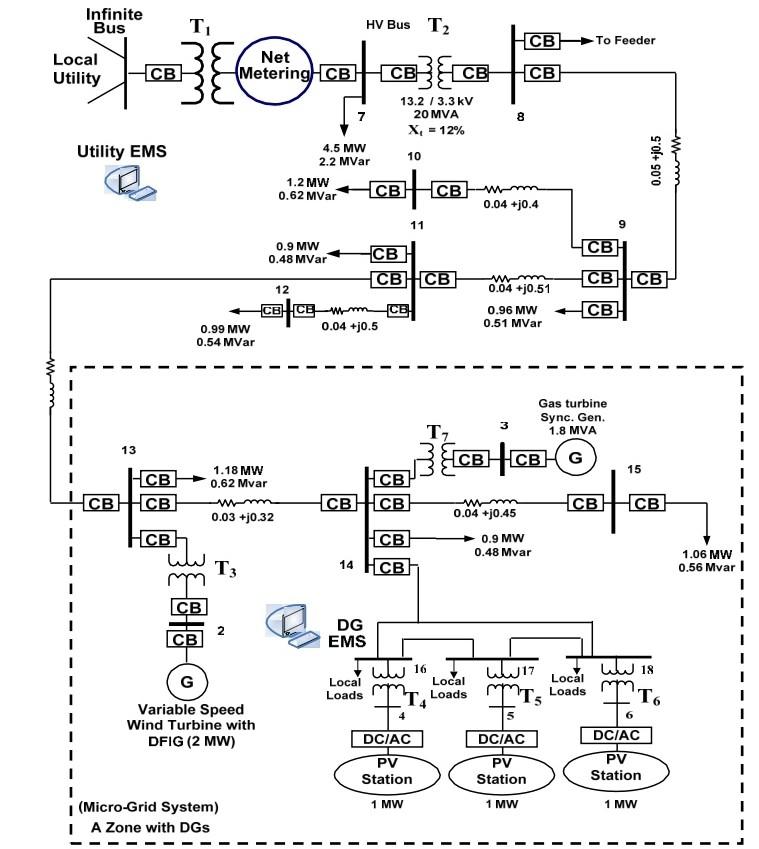
The one-line diagram of a power grid is depicted by Fig. 1. The data for the grid are given in the figure. Assume an MVA base of 100 and base voltage of at bus 7 ; also assume the input reactance of the local power grid is based on the transformer . The input resistance of the PV sources is based on their rating and input reactance of other sources is base on their ratings. The local loads (bus 16 , bus 17 and bus 18) and bus 8 are set at 1 MVA at 0.85 power factor lagging. The system data are Transformer reactance Transformer MVA, reactance Transformer MVA, reactance Transformer , and MVA, reactance Transformer reactance Transmission line impedance is given in Table 1 TABLE 1 Transmission Line Data for Simulation Problem 3.
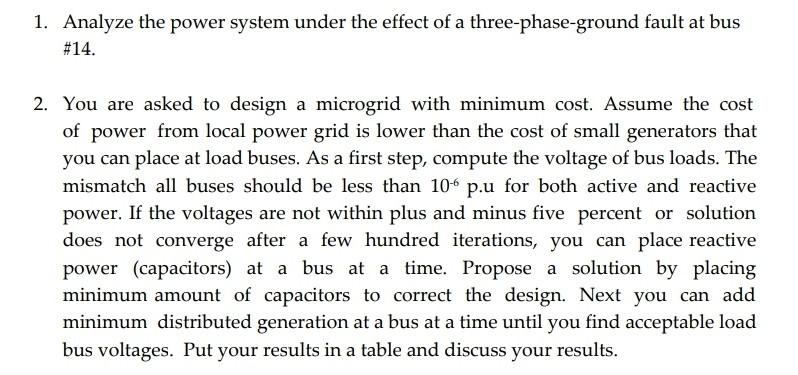
1. Analyze the power system under the effect of a three-phase-ground fault at bus \#14. 2. You are asked to design a microgrid with minimum cost. Assume the cost of power from local power grid is lower than the cost of small generators that you can place at load buses. As a first step, compute the voltage of bus loads. The mismatch all buses should be less than p.u for both active and reactive power. If the voltages are not within plus and minus five percent or solution does not converge after a few hundred iterations, you can place reactive power (capacitors) at a bus at a time. Propose a solution by placing minimum amount of capacitors to correct the design. Next you can add minimum distributed generation at a bus at a time until you find acceptable load bus voltages. Put your results in a table and discuss your results.
Expert Answer
From the given information i have provided the solution in the form of images: