Home /
Expert Answers /
Other Math /
the-process-control-chart-above-shows-a-an-abnormal-process-b-normal-variations-in-a-process-c-pa884
(Solved): The process control chart above shows: a. an abnormal process. b. normal variations in a process c. ...
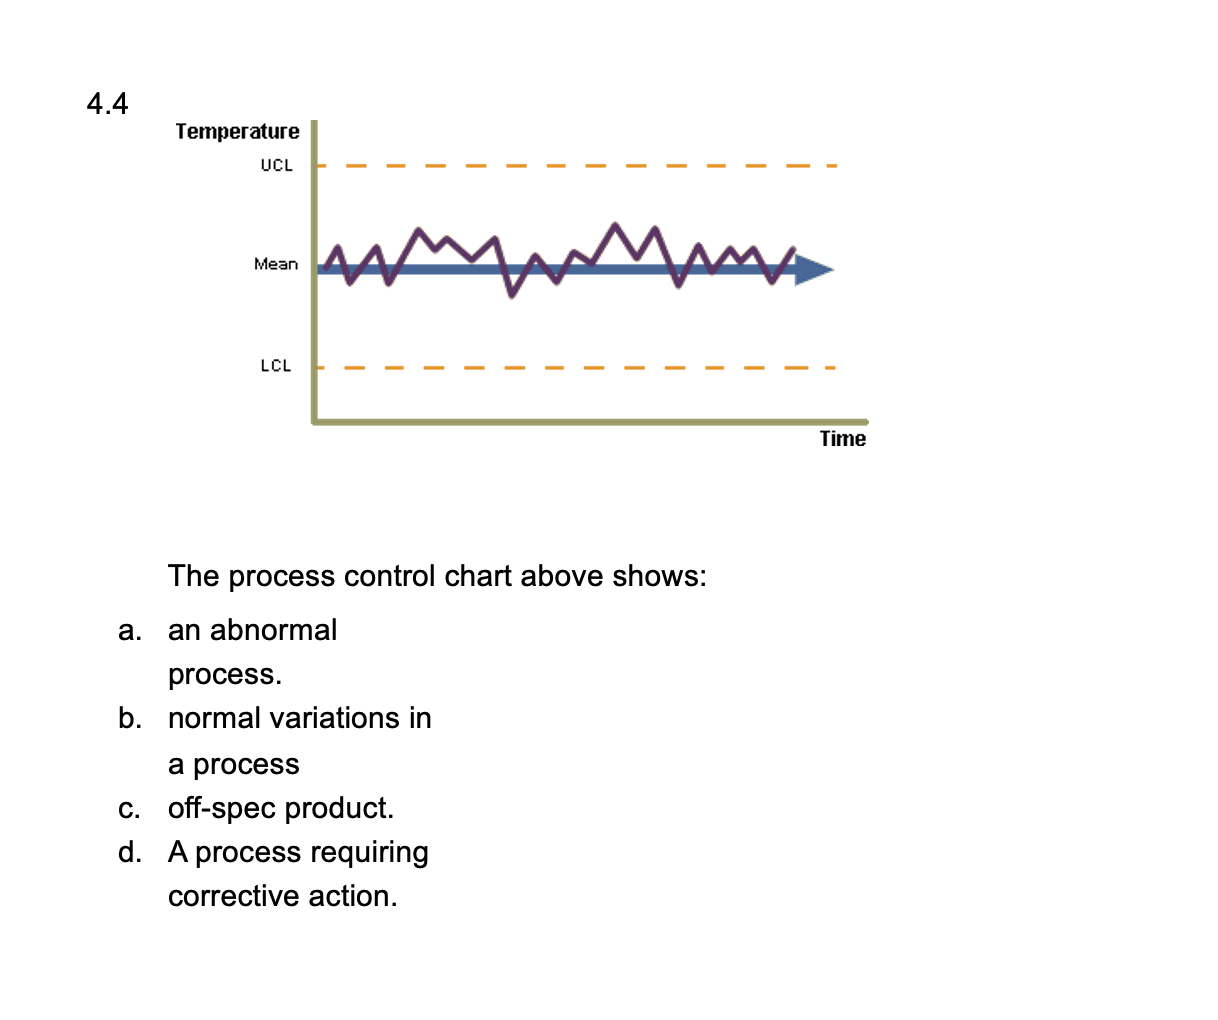
The process control chart above shows: a. an abnormal process. b. normal variations in a process c. off-spec product. d. A process requiring corrective action.