Home /
Expert Answers /
Calculus /
the-rectangles-in-the-graph-below-illustrate-a-riemann-sum-for-f-x-5sinx-on-the-interval-0-h-pa609
(Solved): The rectangles in the graph below illustrate a Riemann sum for f(x)=5sinx on the interval [0,]. h ...
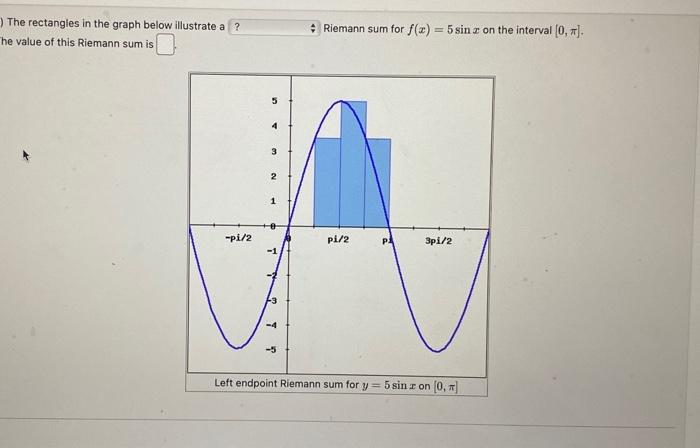
The rectangles in the graph below illustrate a Riemann sum for on the interval . he value of this Riemann sum is
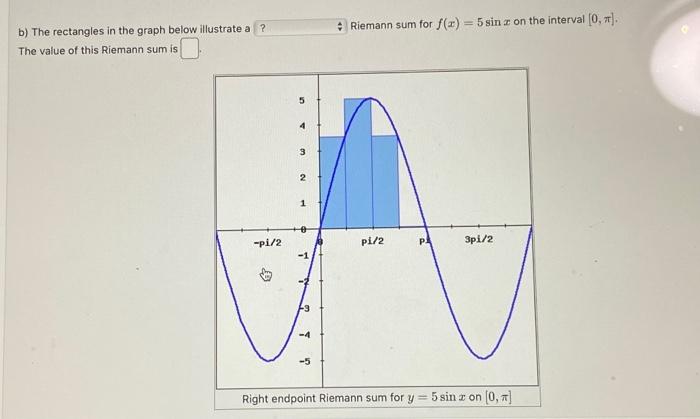
b) The rectangles in the graph below illustrate a Riemann sum for on the interval . The value of this Riemann sum is
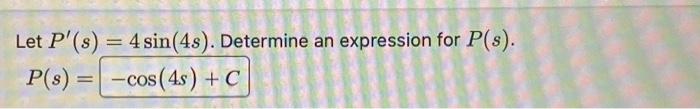
Let . Determine an expression for .
Expert Answer
1.Given the function: number of sub-intervals, The width of sub-intervals are:Using, , the value of at endpoints of rectangles are: