Home /
Expert Answers /
Electrical Engineering /
the-residual-sideband-demodulator-ayb-in-figure-is-given-in-the-figure-determine-the-frequency-cha-pa725
(Solved): The Residual sideband demodulator(ayb in figure) is given in the figure. Determine the frequency cha ...
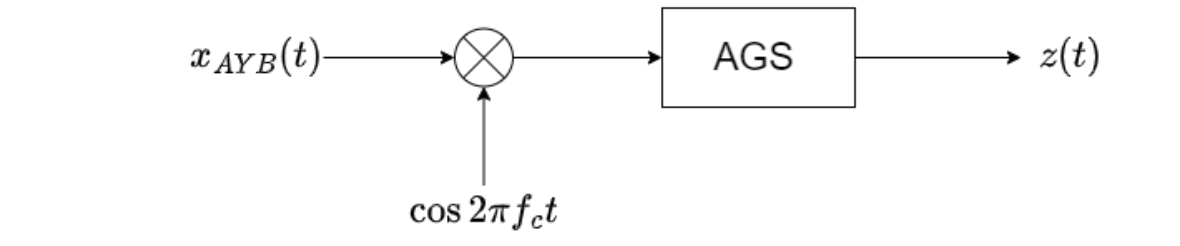
The Residual sideband demodulator(ayb in figure) is given in the figure. Determine the frequency characteristic of the low pass filter (ags in figure). Plot the frequency spectrum of the signal at the low pass filter input with the help of a computer program. The z(t) signal and frequency spectrum at the low pass filter output.
Show that the x(t) sign is recovered by drawing it with the help of a computer program.