Home /
Expert Answers /
Economics /
the-two-side-by-side-graphs-are-for-two-firms-that-between-them-supply-all-the-organically-grown-a-pa233
(Solved): The two side-by-side graphs are for two firms that between them supply all the organically grown a ...
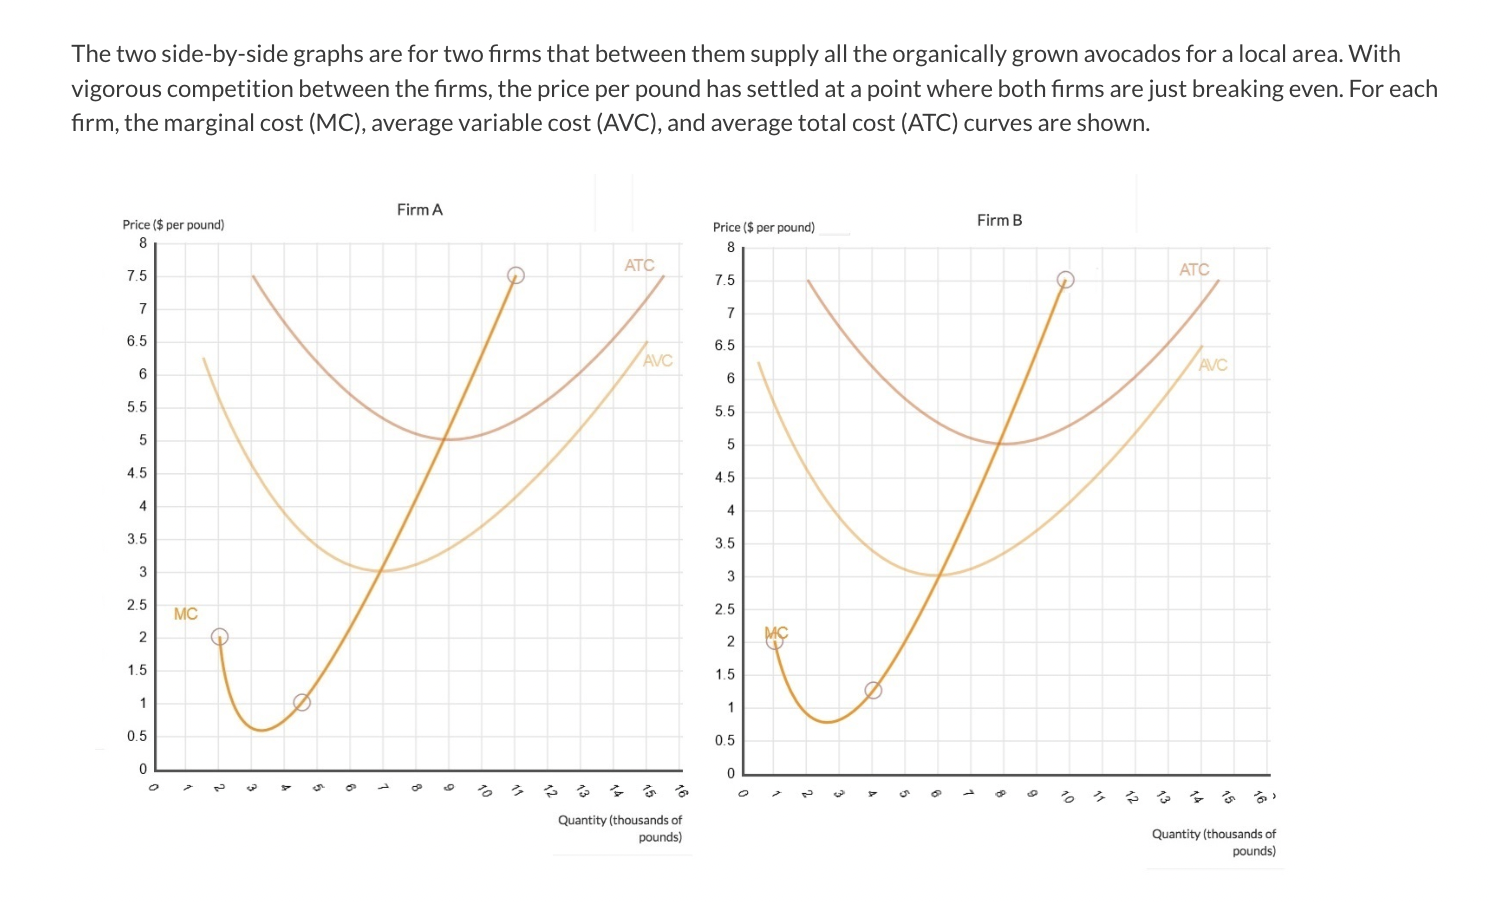
The two side-by-side graphs are for two firms that between them supply all the organically grown avocados for a local area. With vigorous competition between the firms, the price per pound has settled at a point where both firms are just breaking even. For each firm, the marginal cost (MC), average variable cost (AVC), and average total cost (ATC) curves are shown.
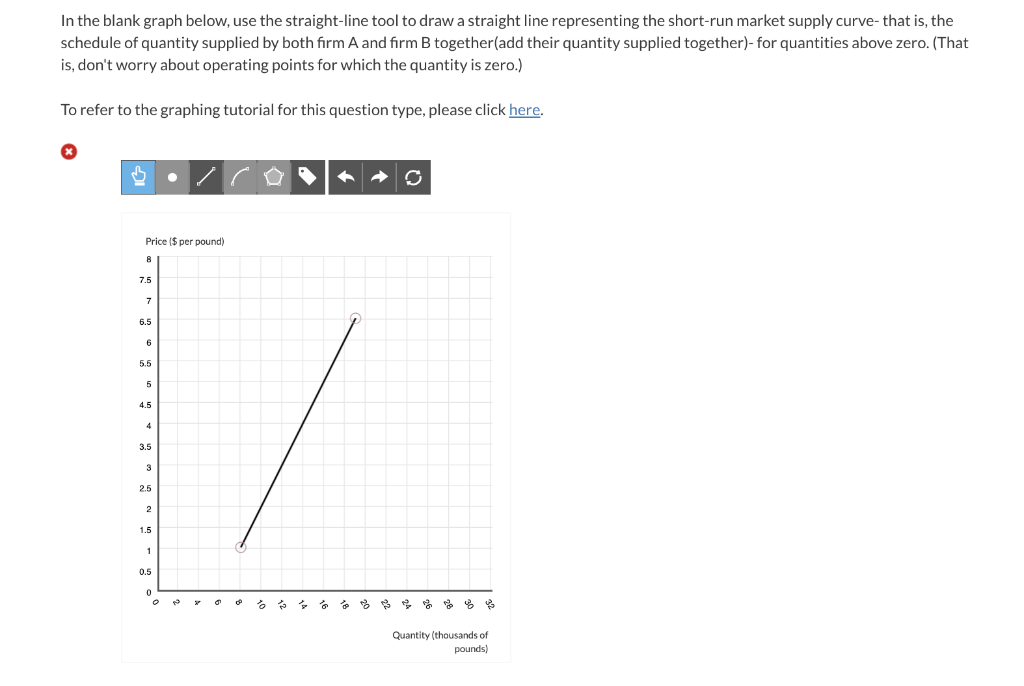
In the blank graph below, use the straight-line tool to draw a straight line representing the short-run market supply curve- that is, the schedule of quantity supplied by both firm \( A \) and firm \( B \) together(add their quantity supplied together)- for quantities above zero. (That is, don't worry about operating points for which the quantity is zero.) To refer to the graphing tutorial for this question type, please click here.
Expert Answer
Supply curve is the part of MC curve above the minimum AVC level. Supply curve for a firm sta