Home /
Expert Answers /
Mechanical Engineering /
the-v-t-graph-for-a-train-has-been-experimentally-determined-from-the-data-construct-the-a-a-t-g-pa897
(Solved): The v-t graph for a train has been experimentally determined. From the data, construct the (a) a-t g ...
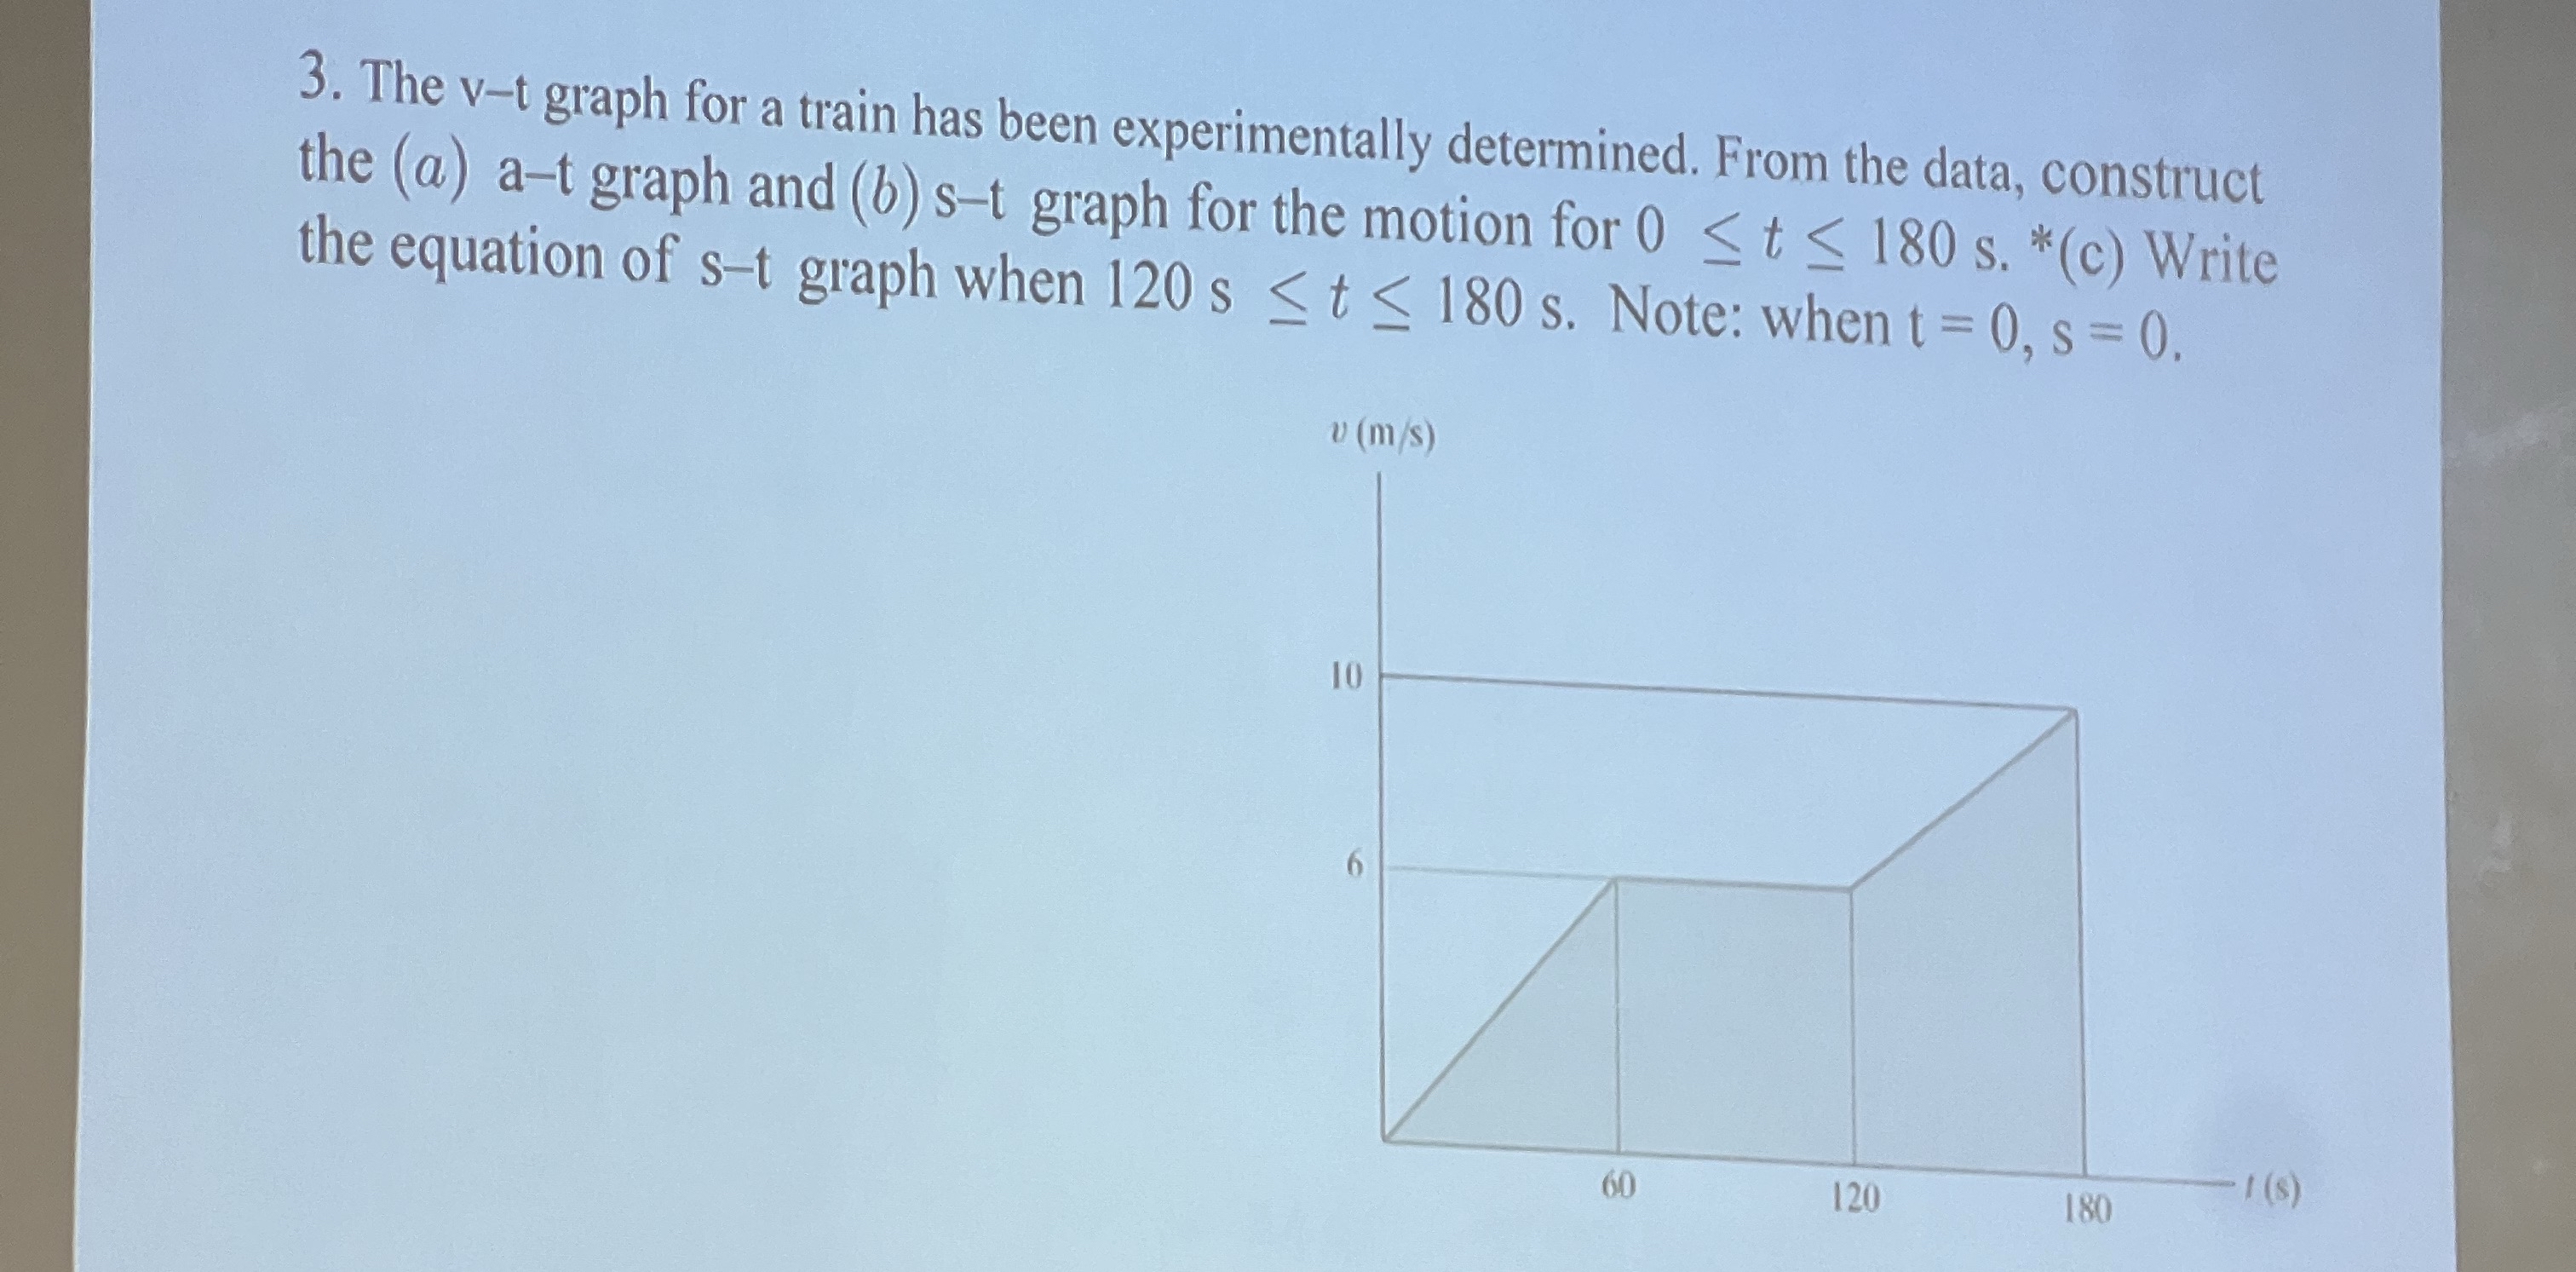
The
v-tgraph for a train has been experimentally determined. From the data, construct the (a) a-t graph and (b) s-t graph for the motion for
0<=t<=180s. *(c) Write the equation of
s-tgraph when
120s<=t<=180s. Note: when
t=0,s=0. Make sure to answer every single part, especially part c!