Home /
Expert Answers /
Biology /
this-is-genetics-gdna-gels-series-1-figure-the-r1-r8-shows-similar-variability-of-results-the-hig-pa723
(Solved): This is genetics gDNA gels series 1 figure . The R1-R8 shows similar variability of results, the hig ...
This is genetics gDNA gels series 1 figure . The R1-R8 shows similar variability of results, the higher the smear, the higher molecular weight comparatively the lower the weight same with molecular weight. R1 to R8 are the amount of times used in the experiment.
Which restriction endonucleases were used? Given all enzymes used recognise specific 6-base pair sequences, what is the predicted frequency of these sites in genome? would you expect digestion with each of the three enzymes to give equivalent results?
Answer the questions above and provide an appropriate figure legend and a separate text explaining the figure.
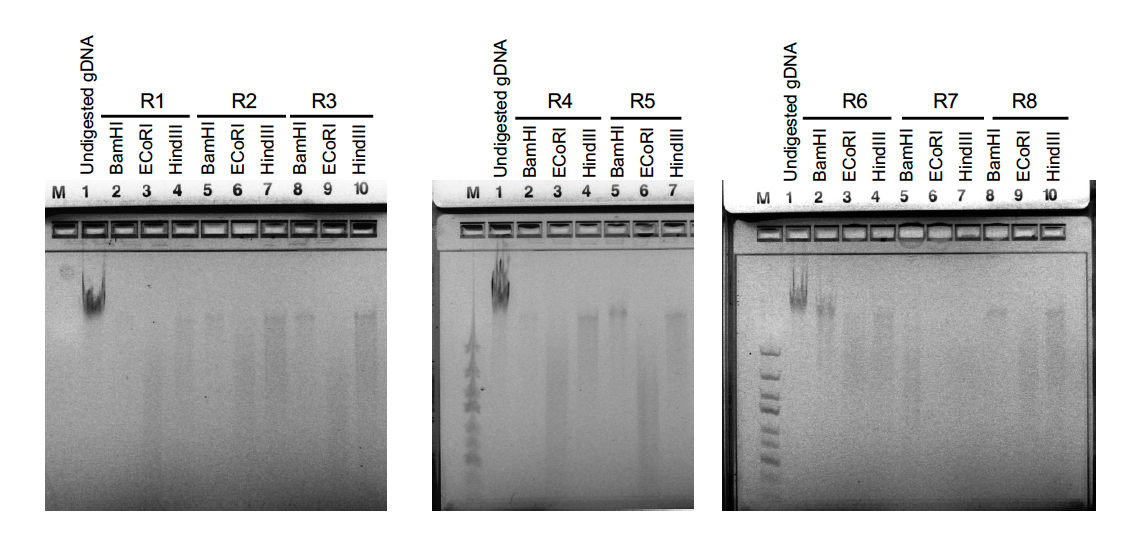
M1 - Undigested DNA BamHI w ECORID Hind III u BamHill ECORIB Hindill BamHI «ECORI ? Hindi - Undigested DNA BamHI w ECORI Hind Ill o BamHI ECORI Hind Ill FEEEEE 3 - Undigested DNA BamHI W ECORI R6 + Hindill o BamHI R7 OECORI Hindill BamHI ECORI 5 Hindill
Expert Answer
Restriction ENDONUCLEASES cleaves(Cuts) the phosphodiester bond of DNA at specific sites in the polynucleotide chain. However, the Cut may be Blunt or Staggered (aka. Sticky or cohesive) to pro