Home /
Expert Answers /
Statistics and Probability /
this-question-relates-to-the-plot-in-figure-4-a-sketch-the-tree-corresponding-to-the-partition-pa980
(Solved): This question relates to the plot in Figure 4 . (a) Sketch the tree corresponding to the partition ...
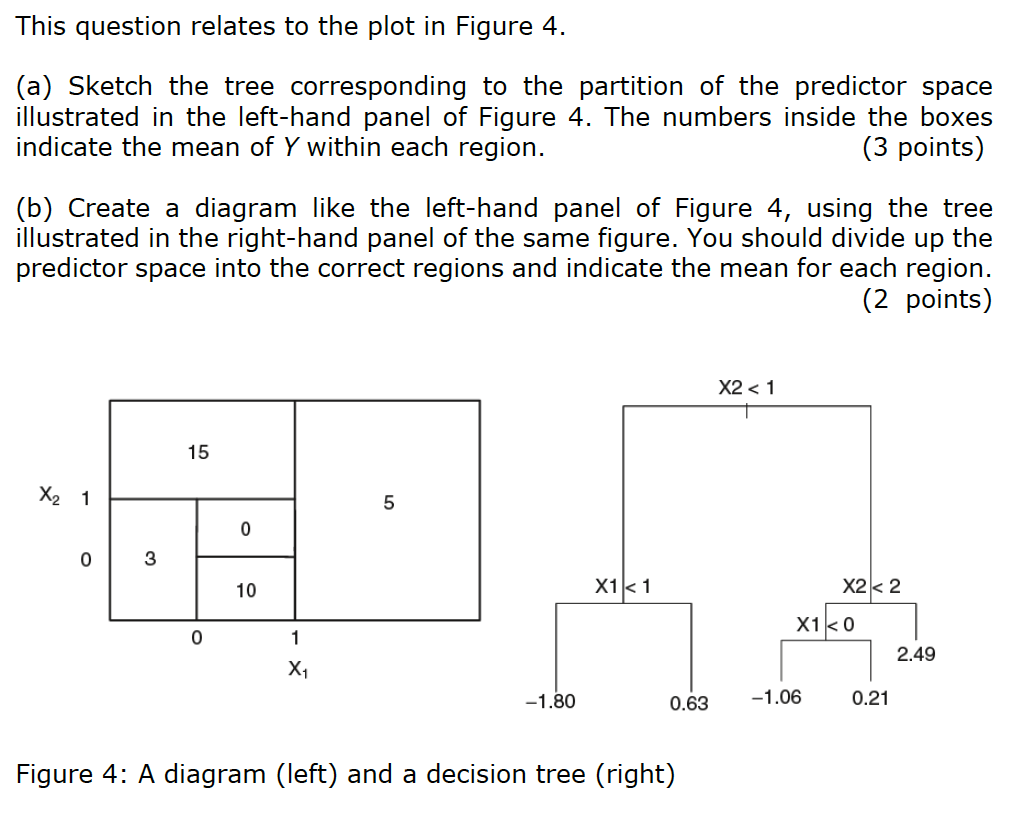
This question relates to the plot in Figure 4 . (a) Sketch the tree corresponding to the partition of the predictor space illustrated in the left-hand panel of Figure 4. The numbers inside the boxes indicate the mean of \( Y \) within each region. (3 points) (b) Create a diagram like the left-hand panel of Figure 4, using the tree illustrated in the right-hand panel of the same figure. You should divide up the predictor space into the correct regions and indicate the mean for each region. (2 points) Figure 4: A diagram (left) and a decision tree (right)