Home /
Expert Answers /
Statistics and Probability /
urgent-nbsp-plsease-please-help-nbsp-charts-already-createdintroductionthe-introduction-should-des-pa458
(Solved): URGENT!! PLSEASE PLEASE HELP charts already createdIntroductionThe introduction should des ...
URGENT!!
PLSEASE PLEASE HELP
charts already created
Introduction
The introduction should describe the objective of this report. In two to four sentences, say the main purpose and/or findings from your analysis so the reader can easily pick out the purpose of this document. Please note that it is okay if this section feels redundant with information that is expanded upon later. It is like a summary of what the reader can expect.
Data Analysis (Please be sure to include each of the three subheadings, presented here in italics.)
Descriptive Statistics for the Price of the Wines
In this paragraph describe the nature of the data, including the independent and dependent variables being explored. The mean is 31 which is bigger than the mode of 20, this shows us the skew of the histogram is right skewed/positive. What does this tell us about wine prices?
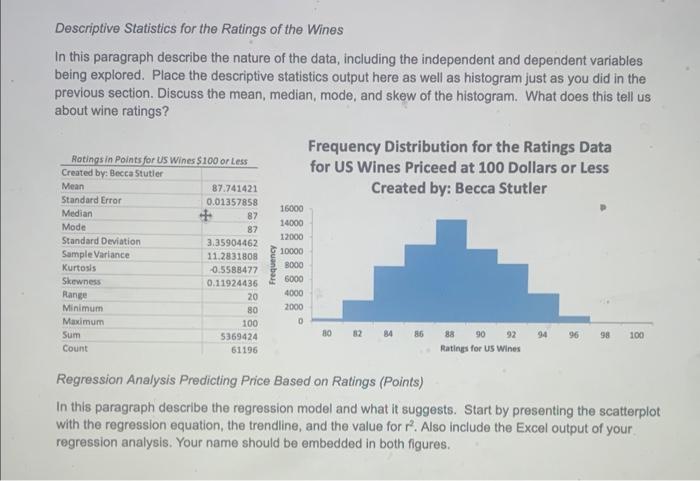
Descriptive Statistics for the Ratings of the Wines
In this paragraph describe the nature of the data, including the independent and dependent variables being explored. Place the descriptive statistics output here as well as histogram just as you did in the previous section. Discuss the mean, median, mode, and skew of the histogram. What does this tell us about wine ratings?
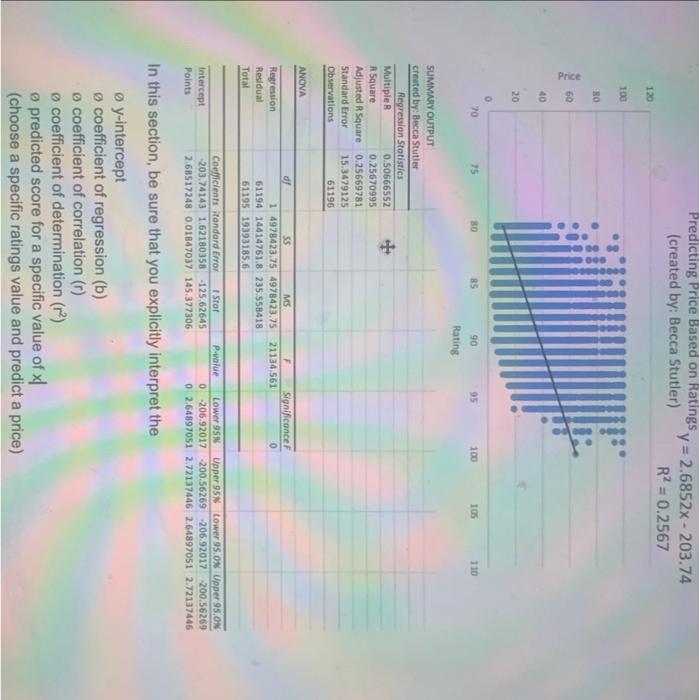
Regression Analysis Predicting Price Based on Ratings (Points)
In this paragraph describe the regression model and what it suggests. Start by presenting the scatterplot with the regression equation, the trendline, and the value for r2. Also include the Excel output of your regression analysis. Your name should be embedded in both figures.
In this section, be sure that you explicitly interpret the
Ø y-intercept
Ø coefficient of regression (b)
Ø coefficient of correlation (r)
Ø coefficient of determination (r2)
Ø predicted score for a specific value of x
(choose a specific ratings value and predict a price)
Summarize finding in terms of recommendations for upper management
In the final summary paragraph, it is okay if this section feels redundant with information already presented. This is summarizing the main points of your findings. Typically, this is about three short paragraphs.
Ø Contains brief (1-2 paragraphs) description of the data and how to better understand the relationship between ratings and price and includes interpretation of slope, correlation coefficient and regression coefficient
Ø Conclusion includes comments about anything you think is surprising, concerns you, or you think is generally interesting or might be useful for upper management.
Ø Conclusion includes a summary of your findings (takeaway message) that describes how the management might be able to use these results to price their wine
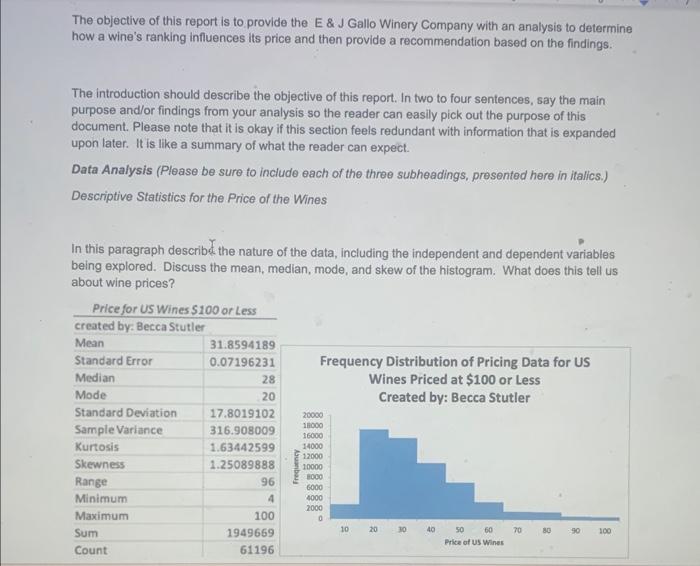
The objective of this report is to provide the E \& J Gallo Winery Company with an analysis to determine how a wine's ranking influences its price and then provide a recommendation based on the findings. The introduction should describe the objective of this report. In two to four sentences, say the main purpose and/or findings from your analysis so the reader can easily pick out the purpose of this document. Please note that it is okay if this section feels redundant with information that is expanded upon later. It is like a summary of what the reader can expect. Data Analysis (Please be sure to include each of the three subheadings, presented here in italics.) Descriptive Statistics for the Price of the Wines In this paragraph described the nature of the data, including the independent and dependent variables being explored. Discuss the mean, median, mode, and skew of the histogram. What does this tell us about wine prices?
Descriptive Statistics for the Ratings of the Wines In this paragraph describe the nature of the data, including the independent and dependent variables being explored. Place the descriptive statistics output here as well as histogram just as you did in the previous section. Discuss the mean, median, mode, and skew of the histogram. What does this tell us about wine ratings? Frequency Distribution for the Ratings Data for US Wines Priceed at 100 Dollars or Less Created by: Becca Stutler Regression Analysis Predicting Price Based on Ratings (Points) In this paragraph describe the regression model and what it suggests. Start by presenting the scatterplot with the regression equation, the trendline, and the value for \( r^{2} \). Also include the Excel output of your regression analysis. Your name should be embedded in both figures.
Predicting Price Based on Ratings \( y=2.6852 x-203.74 \) (created by: Becca Stutler) \( \left.R^{2}=n\right) 2567 \) In this section, be sure that you explicitly interpret the ? y-intercept ? coefficient of regression (b) \( \emptyset \) coefficient of correlation (r) - coefficient of determination \( \left(r^{2}\right) \) ? predicted score for a specific value of \( x \mid \) (choose a specific ratings value and predict a price)
Expert Answer
DESCRIPTION In this report we are trying to summarize a winery company's ratings for US wines based on the prices set by the company. We are trying to