Home /
Expert Answers /
Statistics and Probability /
use-the-data-shown-in-the-table-replace-each-x-value-and-y-value-in-the-table-with-its-pa279
(Solved): Use the data shown in the table. Replace each \( x \)-value and \( y \)-value in the table with its ...
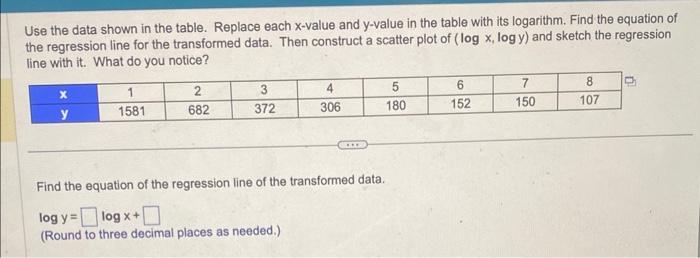
Use the data shown in the table. Replace each \( x \)-value and \( y \)-value in the table with its logarithm. Find the equation of the regression line for the transformed data. Then construct a scatter plot of \( (\log x, \log y) \) and sketch the regression line with it. What do you notice? Find the equation of the regression line of the transformed data. \[ \log y=\log x+ \] (Round to three decimal places as needed.)
Expert Answer
log y = -1.282 log x + 7.378 [ explanation : the necessary transformed data table :- log x log y 0.00000 7.365813 0.693147 6.52