Home /
Expert Answers /
Statistics and Probability /
use-the-given-data-to-do-the-followinga-find-the-regression-equation-for-the-data-pointsb-graph-th-pa820
(Solved): Use the given data to do the followinga. find the regression equation for the data pointsb. graph th ...
Use the given data to do the following
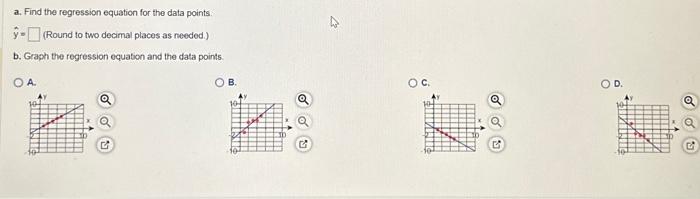
a. find the regression equation for the data points
b. graph the regression equation and the data points.
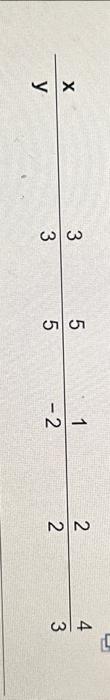
\begin{tabular}{rrrrrr} \( \mathbf{x} \) & 3 & 5 & 1 & 2 & 4 \\ \hline \( \mathbf{y} \) & 3 & 5 & \( -2 \) & 2 & 3 \end{tabular}
a. Find the regression equation for the data points: \( \hat{y}=\quad \) (Round to two decimal places as needed.) b. Graph the regression equation and the data points. A. B. C. D.
Expert Answer
Solution: Given data is, n=5 Excel-->data-->data analysis-->Regression input x range: select column x input y range: select column y select labels box