Home /
Expert Answers /
Computer Science /
using-python-to-generate-stem-and-leaf-diagram-with-frequencies-of-values-nbsp-d-a-stem-and-lea-pa899
(Solved): Using Python to generate stem and leaf diagram with frequencies of values. d. A Stem and Lea ...
Using Python to generate stem and leaf diagram with frequencies of values.
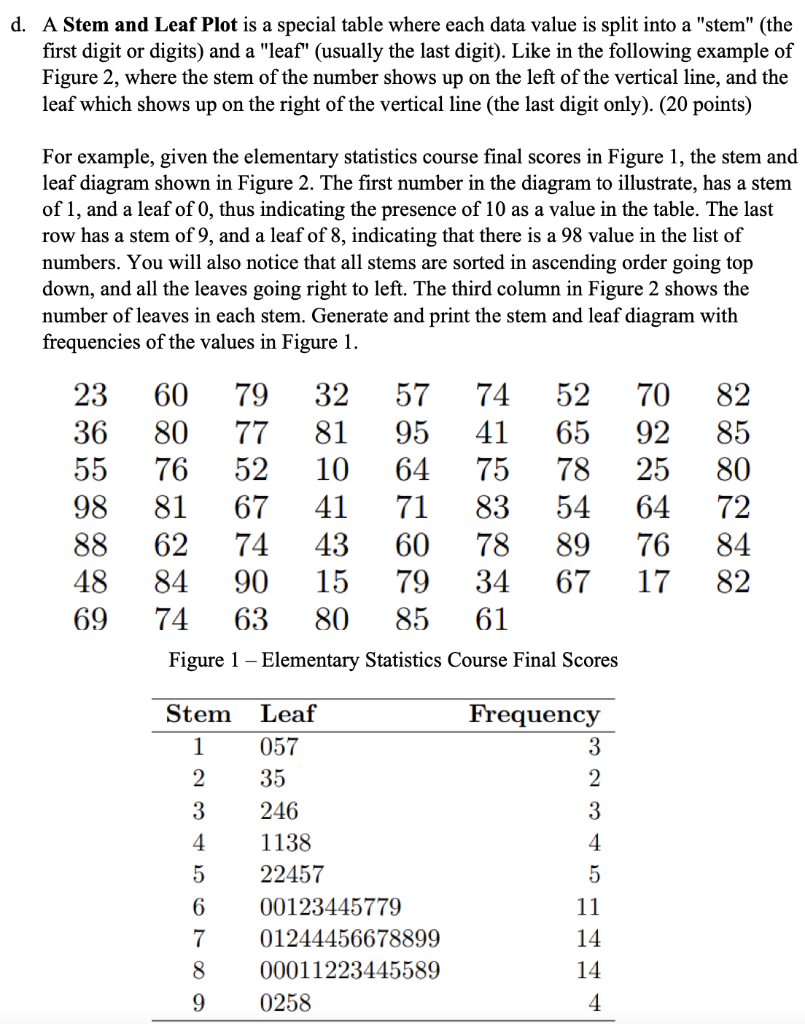
d. A Stem and Leaf Plot is a special table where each data value is split into a "stem" (the first digit or digits) and a "leaf" (usually the last digit). Like in the following example of Figure 2, where the stem of the number shows up on the left of the vertical line, and the leaf which shows up on the right of the vertical line (the last digit only). (20 points) For example, given the elementary statistics course final scores in Figure 1, the stem and leaf diagram shown in Figure 2. The first number in the diagram to illustrate, has a stem of 1, and a leaf of 0, thus indicating the presence of 10 as a value in the table. The last row has a stem of 9, and a leaf of 8, indicating that there is a 98 value in the list of numbers. You will also notice that all stems are sorted in ascending order going top down, and all the leaves going right to left. The third column in Figure 2 shows the number of leaves in each stem. Generate and print the stem and leaf diagram with frequencies of the values in Figure 1. 23 60 79 32 57 52 70 82 36 80 77 81 95 41 65 92 85 55 76 52 10 64 78 25 80 98 81 67 41 71 83 54 64 72 88 62 74 43 60 78 89 76 84 48 84 90 15 79 34 67 17 82 69 74 63 80 85 61 Figure 1 - Elementary Statistics Course Final Scores Stem Leaf Frequency 1 057 3 2 35 2 3 246 3 4 1138 4 5 22457 5 6 00123445779 11 7 01244456678899 14 8 00011223445589 14 9 0258 4 74 1 75 88
Expert Answer
You can install this matplotlib library from Jupyter Notebook as – import sys !{sys.executable} -m pip install matplotlib import