Home /
Expert Answers /
Operations Management /
when-a-process-is-in-control-it-results-in-there-being-on-average-16-defects-per-unit-of-output-pa251
(Solved): When a process is in control, it results in there being, on average, 16 defects per unit of output ...
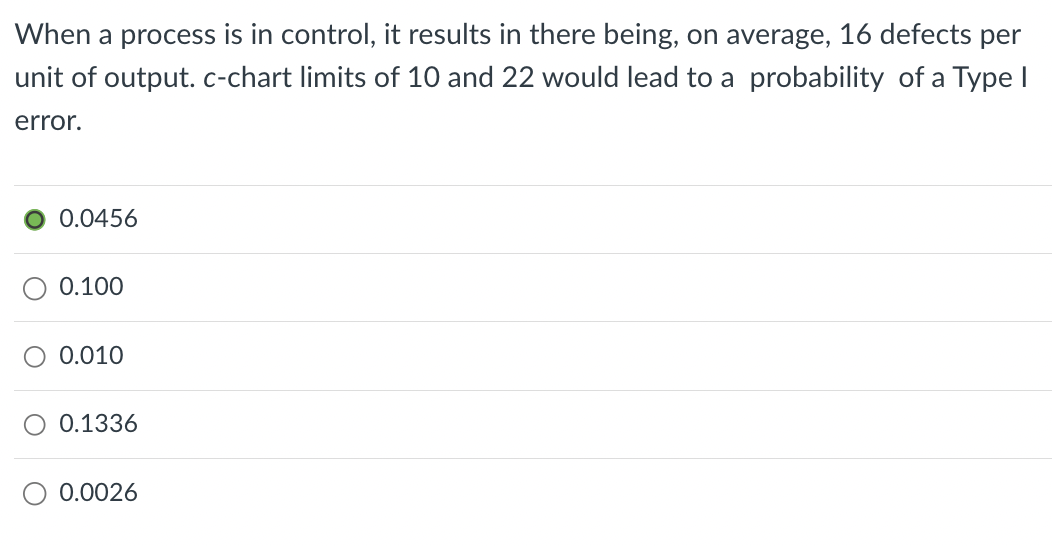
When a process is in control, it results in there being, on average, 16 defects per unit of output. c-chart limits of 10 and 22 would lead to a probability of a Type I error. \[ 0.0456 \] \[ 0.100 \] \( 0.010 \) \( 0.1336 \) \( 0.0026 \)