Home /
Expert Answers /
Computer Science /
y-xtan-theta-1-2-x-2-g-v-0-cos-theta-2-y-0-where-y-is-the-height-x-is-the-horizont-pa991
(Solved): y=xtan\theta -(1)/(2)(x^(2)g)/((v_(0)cos\theta )^(2))+y_(0) where y is the height, x is the horizont ...
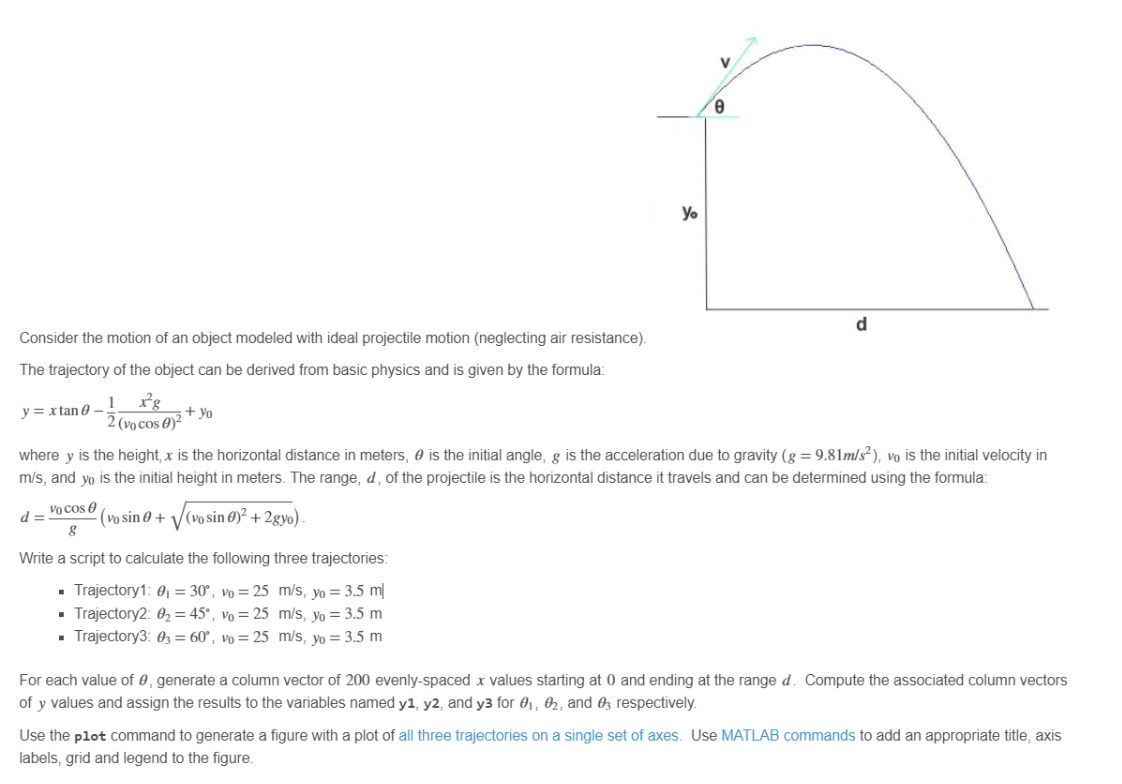
y=xtan\theta -(1)/(2)(x^(2)g)/((v_(0)cos\theta )^(2))+y_(0)
where y is the height, x is the horizontal distance in meters, \theta  is the initial angle, gg=9.81(m)/(s^(2)) v_(0) is the initial velocity in
(m)/(s), and y_(0) is the initial height in meters. The range, d, of the projectile is the horizontal distance it travels and can be determined using the formula:
d=(v_(0)cos\theta )/(g)(v_(0)sin\theta +\sqrt((v_(0)sin\theta )^(2)+2gy_(0)))
Write a script to calculate the following three trajectories:
Trajectory1: \theta _(1)=30\deg ,v_(0)=25(m)/(s),y_(0)=3.5(m)/()
Trajectory2: \theta _(2)=45\deg ,v_(0)=25(m)/(s),y_(0)=3.5m
Trajectory3: \theta _(3)=60\deg ,v_(0)=25(m)/(s),y_(0)=3.5m
For each value of \theta , generate a column vector of 200 evenly-spaced x values starting at 0 and ending at the range d. Compute the associated column vectors
of y values and assign the results to the variables named y1,y2, and y3 for \theta _(1),\theta _(2), and \theta _(3) respectively.
Use the plot command to generate a figure with a plot of all three trajectories on a single set of axes. Use MATLAB commands to add an appropriate title, axis
labels, grid and legend to the figure.