Expert Answers

(Solved): 13. A manager uses the following equation to predict monthl...

13. A manager uses the following equation to predict monthly receipts: Yt = 40,000 + 150t. What is the forecast for August if

13. A manager uses the following equation to predict monthly receipts: Yt = 40,000 + 150t. What is the forecast for August if t = 0 in April of this year? A. 40,450 € B. 40,600+ C. 42,100 D. 42,250+

(Solved): 13. Which terms signal a deductive argument? a) Formally, b...

13. Which terms signal a deductive argument? a) Formally, broadly, and odds are b) Necessarily, it follows that, and absolute

13. Which terms signal a deductive argument? a) Formally, broadly, and odds are b) Necessarily, it follows that, and absolutely c) Probably, chances are, and likely d) It is plausible that, almost, and finally 14. An inductive argument is intended to provide which of the following? a) Truth-preserving support for its conclusion b) Weak support for its conclusion c) Probable support for its conclusion d) Valid support for its conclusion e

(Solved): 13. If a state adopts a uniform code, which of the following...

13. If a state adopts a uniform code, which of the following istrue?

  1. it becomes state statutory law.
  2. it is automatically deemed to constitutional.
  3. it must be same as adopted in every other state that adoptedit.
  4. it becomes part of state common law.

15. The concept of minimum contacts applies to?

  1. Whether a defendant has been properly served with a complaintand summons.
  2. Whether a federal court has diversity jurisdiction.
  3. Whether a case can be brought in a specialty court,
  4. Whether a plaintiff can sue an out of state defendant in thestate in which the plaintiff is a citizen

16. If a state law violates the state constitution but not theU.S. constitution, which of the following is true?

  1. as long as it does not violate the U.S. constitution, it isenforceable.
  2. None of the alternatives are correct.  
  3. whether it is enforceable depends on whether the state law iscommon law.
  4. it is wholly unenforceable.

17. The difference between common law and case law is which ofthe following?

  1. There is no difference between case law and common law.
  2. Common law is a judicial interpretation of the a statute,whereas case law is a body of law created by years of courtdecisions.
  3. Case law is a judicial interpretation of the a statute, whereascommon law is a body of law created by years of courtdecisions.
  4. both are forms of regulations issued by administrativeagencies.

18. Which best describes the relationship between the U.S.Constitution and a state Constitution?

  1. co-equal in how they are enforced
  2. the state constitution cannot violate the U.S.Constitution.
  3. the U.S. Constitution cannot violate the stateconstitution
  4. they are independent of each other.

19. Asher sues Miranda because her dog barks a lot and he isfearful that the dog will bite him. What is the likely outcome?

  1. Asher does not have standing to bring the case.
  2. Asher must file the suit in family court because it is adomestic issue
  3. Asher must file the suit in state court because he and Mirandaare from the same state.
  4. Miranda can file a counterclaim against Asher claiming he isagitating her dog.

(Solved): 131. What is the point of the Activity Network diagram?Selec...

131. What is the point of the Activity Network diagram?

Select one:

a. To determine what activities occur at the same time

b. To understand the sequential and time relationships in aprocess

c. All of the above.

d. To determine what activities come first

132. In most tests, what data types can you test?

Select one:

a. Summarized data only

b. Raw data only

c. Raw or Summarized data

d. Confirmed data only

133. What is ANOVA's function?

Select one:

a. A hypothesis test that deals with more than two populationsor factors of X.

b. A hypothesis test that deals with less than two populationsor factors of X.

c. A hypothesis test that deals with more than a singlepopulation or factor of X.

d. A hypothesis test that deals with infinite populations andfactors.

134. What is the disadvantage of using existing data?

Select one:

a. It is not always clean

b. It is too difficult to analyze

c. Too much data may exist.

d. It is too simplified

135. What are ways you can statistically increase confidence inyour conclusion?

Select one:

a. Choosing appropriate sample sizes

b. Validate Assumptions

c. All of the above

d. Validate Data

136. What is the benefit of using a curve over a histogram?

Select one:

a. It's a more efficient use of color.

b. It proves that there are different ways to show the samedata.

c. It makes the shape of data more readily apparent.

d. It is easier to show errors in data.

137. What type of data does Proportion testing require?

Select one:

a. Means of samples

b. Rates

c. Standard deviations

d. Sample variance

(Solved): 13.2(pages 572-576) Graphic methods - aggreate planning tech...

13.2

(pages 572-576) Graphic methods - aggreate planning techniquesthat work with a few variables at a time to allow planners tocompare protected demand with existing capacity

- 5 steps in graphical methods:

+ determine the demand in each period

+ determine capacity all the time

+ find labor cost, hiring, and layoff cost and inventory holdingcost.

+ consider company policy that may apply to workers or stocklevels

• 13.1 Jan. Problems Note: Px means the problem may be solved with POM for Windows and/or Excel OM Problems 13.1-13.22 relate
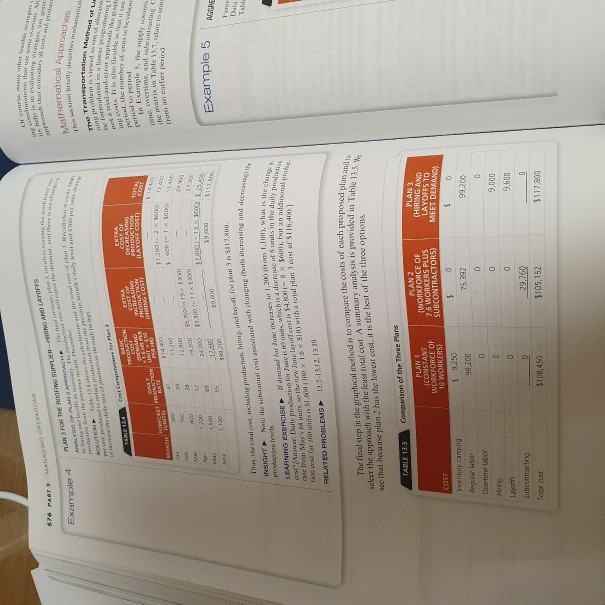
+ develop alternative plans andexamine total cost

• 13.1 Jan. Problems Note: Px means the problem may be solved with POM for Windows and/or Excel OM Problems 13.1-13.22 relate to Methods for Aggregate Planning Construct a graph for the daily demand and the average daily The table below provides information about the demand forecast. demand forecast and the number of working days for a tools 13.2 Develop two other plans for the Mexican roofing manufacturing factory in Egypt. manufacturer described in Examples 1 to 4 (pages 572-576) and Solved Problem 13.1 (page 588). a) For Plan 5, use constant workforce of eight workers for the MONTH PRODUCTION DAYS FORECAST DEMAND (UNITS) first 3 months and ten workers for the last 3 months. Use sub- 22 1,000 contracting to meet the remainder of demand. Feb. 19 1,200 b) For Plan 6, use a constant workforce of nine. Use subcontracting Mar 21 1,100 to meet the remainder of demand. Apr 20 1,200 c) Out of 1-6, which plan is the best and why? PX 22 1,300 ... 13.3 The president of Hill Enterprises, Terri Hill, projects 21 the firm's aggregate demand requirements over the next 8 months M 20 1,250 as follows: 22 1,400 May 2,200 21 Feb. 1,600 June 2,200 22 1,400 Mar. 1.800 July 1,800 22 1,800 Aug 1,800 20 May June 1,200 1,300 1,300 Jan. Aug Sept Od Nov. Dec. 1,200 1,000 Apr.

(Solved): 13.2 Develop two other plans for the Mexican roofingmanufact...

Class INS The TER ARCH Mathematical Approach The braly destinac Nem is viwawa Transportation method of Tandora DIE LIM the nu


The graph for Example 2 Wit NOWI in Figure 3.3 . Some platne pretragraph peu in figure 11.4 . Note that both the level produc

574 PAT MANAGING CAO 5 CURS ON have to do les into the superiodam . the March the hybem Alph . We nemory The graph for Emple

als when the GOLUTION . dum devording the could be the acht Wir sind more Decacak CHAPTER 13 AGGREGATE PLANNING AND SHOP 573

handdatorn for closes canonicory but panier PHOT predam su lewer drama Further verstellen Montbuchhemm misma them and the bea

AGGREGATE PLANNING AND S&OP 589 CHAPTER 13 SOLUTION DEMAND FOR TOTAL CAPACITY AVAILABLE upply) SUPPLY FROM Perind Period Furi

MANACO OPERATONS Solved Problems word TUNES El Ch DEA SA PART 3 Tom gewiesen escriere secret. Noe het oeryone ones will he co

with POM for Windows and/or Excel OM. he als Construct a graph for the daily demand and the average daily demand forecast. ..

13.2 Develop two other plans for the Mexican roofingmanufacturer described in Ezmaples 1 to 4 (pages 572-576) andSolved Problem 13.1 (page 588).

a) For plan 5, use constant workforce of eight workersfor the first 3 months and ten workers for the last 3 months. Usesub-contracting to meet the remainder of demand.
b) For Plan 6, use a constant workforce of nine. Use subcontractingto meet the remainder of demand.
c) Out of 1-6, which plan is the best and why?

please 13.2
Please hurry up.

Class INS The TER ARCH Mathematical Approach The braly destinac Nem is viwawa Transportation method of Tandora DIE LIM the number will be E ESO convenime , and conte ihmettelo un Nele lost in the has increasing and ranch LEARNING EXERCISEI den storm 1. What is the han to the Junolauleon 34 , SSL but an admob olur . olor de chis orci Sinine days The na siep in the graphical method is 10 compare the costs of Cichoposed pidants select the approach with the least total cost . A Summary analysis is provided in Table 13.5 . We CE No pod NON Tra pod L - 13100 1243 HANS OPERATOR 576 Farra PLANS FOR THE ROOFING SUPPLIENING AND LAYOFFS ALORANSACCH the to Exemple 4 Le bly wearing mited way CNC Plan mot TABLE 12 PRIN COST OF cast CONTOH LAYOFF COST DERING COSTI MONTH UNITS CASTRODUCTION UNIT BATE PERE 514.00 COS TORIAL 11 $1.2001 - 21000 36004-11 12.10 W Feb MA JE 9.2000 2001 39 JOSTI 3200 1920 45 59000 ST Example 5 MY 19,00 TUS Thus the local cliniche production and buy for $11.. Data Preciou leche Do for mits is 1.600 300x16 ) with a tonalplom.com 51166) RELATED PROBLEMS 13.2-13.12.13.19 see that because plan has the lowest oost, it is the best of the three options Comparison of the Three Plans TABLE 13.5 PLAN 2 ( WORKFORCE OF 7.6 WORKERS PLUS SUBCONTRACTORS) PLAN 1 CONSTANT WORKFORCE OF 10 WORKERS) $ 5.250 95.260 PLAN 3 (HIRING AND LAYOFFS 70 MEET DLMAND) D. 99,200 COST 0 $ 75,392 wento carrying Regular babar Overture labor D D 0 0 0 9,000 a 9,600 0 VO Layoffs Subcontracting Tole cost 0 29,760 $105,152 $117.00 The graph for Example 2 Wit NOWI in Figure 3.3 . Some platne pretragraph peu in figure 11.4 . Note that both the level production live and the core o produce o di visually how the forecast deviates from the average requirements . Such a graphs che STCHA production CHAPTER 13 AGGREGATE PLANNING AND SOP 575 For 134 Cart O STUDENT TYP Summer ang 3 UTEM 3.000 9.000 7 Culo thai 1.000 Ex depletin Jan. June Wer Month ENTORY 200 400 500 100 Example 3 A CONSTANT WORKFORCE 1.850 IS PLAN 2 FOR THE ROOFING SUPPLIER--USE OF SUBCONTRACTORS WITHIN ANALYSIS OF PLAN 2 APPROACH Aulul comunt workforce is to seduce ses low enough to inert demand only in March, the breas demon-per-day manila to protece Sunits per day 2 -house. 76 workers are seedol. You can llunk of the as followers I puntimer. Allir demand is set by wahacontracmg Subcentracting is the required in every other month. No inventory holding costs we cured in plan 2 SOLUTION Beruse 6.200 units are required during the greate plan periodwe comprare how many can be made by the Grm and low any way be subcontracte: In-boue peduction - 3 vntprestay x 124 production days - 4.772 Subcontract units 6.300 - 4792 - 1.488 units The costs of plan 2 are computed as follows CALCULATIONS COST (e 75 workers x 58 x 14 de Regular-time labor (14Beurts x 520 ) Subcontracting Total cost hour day: hit 24 days 29749 $105,152 INSIGHT Note the lower cost of regular labor but the added subcontracting co LEARNING EXERCISE ? I demand for June increases to 1.0 (from 1.100, what is the change in cost? Answer: Subcontracting requirements increase to 1.588 * $20 per unit for a contracting cost of $31.700 and a lotal cost of $102,152.1 RELATED PROBLEMS 13.2-13.12, 13:19 750 and 574 PAT MANAGING CAO 5 CURS ON have to do les into the superiodam . the March the hybem Alph . We nemory The graph for Emple the sathe total production Hochschule Colabor - hoboproge worker can make its about 5.000 Cear TABLE sum 4.000 1000 pl ANALYSIS OF PLANT AFTPROACH We the table for the ???????? SOLUTION UNVENTORY to display visually how provided in Figure 134 PDOUCTION AT 50 UNITS PER DAY RORECAST 900 PRODUCTION DAYS MONTHLY INVENTORY CHANGE +200 +200 -250 -150 -400 -TCO 000 22 1B . Tube 100 100 100 1000 1.000 100 1.000 2.500 Example 3 21 22 100 . 1,850 Treat unitentory carried over from 1 month to the next month - 1.850 mins Workforce required to prodo 30 units per day - 10 workers Therefore, to produce 5l units, 10 workers are noted Finally, the costs of plan are computed as follow CALCULATIONS - 1850 units carried x $5 per unit) ( 10 workers x 580 per day 124 dapi COST 5 9.250 99,200 Regular-me anor Omer costs overtime ning Tayolls, subcontracting Total cost 3 3106453 INSIGHT Note the significant cost of carrying the inventory LEARNING EXERCISE ? If demand for June decreases to 1.000 (from 1.100), what is the change in cost? Answer: Total inventory carried will increase to 1.950 at 55. for an inventory cost of 89,750 ani total cost of S108,950 RELATED PROBLEMS 132-13.12, 13.19 EXCEL OM 1382 bed nylab Operations Management ACTIVE MODEL 13.1 This reserved in the 13.1 in MyLab Operations Management. als when the GOLUTION . dum devording the could be the acht Wir sind more Decacak CHAPTER 13 AGGREGATE PLANNING AND SHOP 573 Voo ?????? ab Wote 1 and um Totodom.al Average Number 0,20 - nowy 124 13.3 For 70 20 production, wegge moord Production rate per day 50 of OF 30 Mary FOD 10 ar - Non mer ng dans . Meer 21 22 21 20 Changes in the production cote come ci Win the data are grachel. Note that in INSIGHT Junc is above average LEARNING EXERCISE If demand for Juin increases to 200 Crom 1.100), what is the main Figure 13.3 Answer: The daily rate for Su will go up 10 ), and werage production will increase to 50.8 (6,0/124)1 RELATED PROBLEM 13.1 The graph in Figure 13.3 illustrates how the forecast differs from the average demand. Some sarategies for meeting the forecast were listed carlier. The firm, for example, might stafi in order to yield a production rate that meets average demand as indicated by the dashed line) Or it might produce a steady rate of, say, 30 units and then subcontract exces demand to other roofing suppliers. Other plans might combine overtime work with subcontracting to absorb demand or vary the workforce by hiring and laying oll. Examples 2 10 4 lestrate the possible strategies Example 2 PLAN 1 FOR THE ROOFING SUPPLIER-A CONSTANT WORKFORCE One possible strategy (call it plan for the manufacturer described in Example is to maintain.com stant workforce throughout the 6-month period. A second (plan is to maintam a constant workforce at a level necessary to meet the lowest demand month (March) and to meet all demand above this level by subcontracting. Both plan 1 and plan 2 have level production and are therefore called level state- gies. Plan 3 is to hire and lay of workers as needed to produce exact wontbly requirements - chase strategy. Table 13.3 provides cost information necessary for analyzing these three alternatives handdatorn for closes canonicory but panier PHOT predam su lewer drama Further verstellen Montbuchhemm misma them and the beached to chovem padalona in the past In this we models that hapers c10 DevOps plants . They range from the widely un gruphical ethod to the transportation wedi Grapatections are popular because they are easy to understand and use . These plans with a lew arables al me low price Project With Sampe Cerden nicode Ne but will in the world , anber or loose bendol BARCA on plan , but they require only limited computations and can be performed by clerical wall ADANALI OPERATIONS 572 PART 3 o 13.3 and the planning pro Forest Dem Methods for Aggregate Planning Ticar programming Graphical Methods optimal polit- apical ferits Yoweriala was como Doudig caract: They are trial and enfor approaches that do not guarantee an Following are the live steps in the graphical method: Determine the demand in each period 2 Determine capacity for regular time, overtime, and subcontracting cach period. Find labor costs, Juring and Inyolcasts, and inventory holding costs. Consider company policy that may apply to the workers or to stock levels. 5 Develop alternative plans and examine their total costs These steps are illustrated in Fixamples through 4. LO 13.4 Prepare a graphical aggregate plan Example 1 GRAPHICAL APPROACH TO AGGREGATE PLANNING FOR A ROOFING SUPPLIER Juarez, Mexico, manufacturer of roofing supplies has developed monthly forecasts for a family products Data for the month period January to June are presented in Table 13.2. The firm would like to begin development of an aggregate plan The gras strategic order to Orit me roofing deman strales TABLE 13.2 Monthly Forecasts DEMAND PER DAY (COMPUTED) MAONTH lan EXPECTED DEMAND 900 700 PRODUCTION DAYS 22 41 Feb 18 E Mar 21 21 39 36 57 AUT 800 1,200 1,500 1.100 6,200 22 May June 68 20 55 124 AGGREGATE PLANNING AND S&OP 589 CHAPTER 13 SOLUTION DEMAND FOR TOTAL CAPACITY AVAILABLE upply) SUPPLY FROM Perind Period Furiod 3 2 Capacity (2 D Hegas inventory SO SU > 31 D Regular time 52 310 100 5 50 80 06 6T 0 MI 81 2 Subcontract 50 34 D 50 200 SI Regalar Home MO 69 66 Period 2 Orertime 50 100 65 SD 80 100 54 84 u Subcontract 50 200 58 Regular time 150 73 09 81 50 SO 450 65 50 80 200 750 0 SA 88 84 Period Overtime 3 Subcontract TOTAL DEMAND 200 1.950 450 SSO 200 Cost of plan: Period 1: 50(SO) + 300(550) + 50(365) + 50(580) = $22.250 Period 2: 400X550) + 50(565) + 100(580) - $31.250 Period 3: 50(581) + 450(550) + 50(565) + 200(580) - $45.800 Total cost $99.30 *Includes 50 units of subcontract and carrying cost. Note: Px means the problem may be solved with POM for Windows and/or Excel OM. Problems Problems 13.1-13.22 relate to Methods for Aggregate Planning 13.1 The table below provides information about the cmand forecast and the number of working days for a tools manufacturing factory in Egypt. Construct a graph for the daily demand and the average demand forecast 13.2 Develop two other plans for the Mexican manufacturer described in Examples 1 to 4 (pages 572-5 Solved Problem 13.1 (page 388). a) For Plan 5, use constant workforce of eight works und te workers for the last 3 months MANACO OPERATONS Solved Problems word TUNES El Ch DEA SA PART 3 Tom gewiesen escriere secret. Noe het oeryone ones will he country in the min. SOLVEDPOLEN PRODUCTION NERED ENDING INVENTORY SOLUTION BESIMI INVENTORY bus PRODUCTION ATO LIMITS PER DAY FOCUSTOM 100 MONTH 720 900 1.200 1,500 1.100 DUITS 1.2.0 21 ART 22 20 Constatals x 55/month - 5400 worker x Say I days $99.260 To podwe 200 units at overtime rare rires 120 x 1.6 loots/ unit -- 1,984 bours O crime cost 317/hour X 1,984 hours - $32728 Plan 4 COSTS WORKFORCE OF 8 PLUS OVERTIME) Carrying cost Camed x 3 featrica) 78.16 wules sabay X 124 days 33,728 11.954 hours x Sour Hiring or Subcontracting Total con $113,658 Plan 1. ar SIOS 152, is still preferable. SOLVED PROBLEM 13.2 A Dover, Delaware plant has developed the accompag supply, demand, cost, and inventory data. The firm has a con stant workforce and meets all its demand, Allocate production capacity to satisfy demand at a minimum cost. What is the cost of this plan Demand Forecast PERIOD DEMAND (UNITS) 450 2 550 3 750 Supply Capacity Available (units) REGULAR PERIOD TIME OVERTIME SUBCONTRACT Other data Initial inventory Regular.time cost per unit Overtime cast per unit Subcontract cost per unit Carrying cost per urut per period Backorder cost per unit per period 50 Uruits 550 $65 $80 $1 50 200 300 2 400 200 50 3 450 50 200 with POM for Windows and/or Excel OM. he als Construct a graph for the daily demand and the average daily demand forecast. .. 13.2 Develop two other plans for the Mexican roofing manufacturer described in Examples 1 to 4 (pages 572-576) and Solved Problem 13.1 (page 588). a) For Plan 5, use constant workforce of eight workers for the first 3 months and ten workers for the last 3 months. Use sub- contracting to meet the remainder of demand. b) For Plan 6, use a constant workforce of nine. Use subcontracting to meet the remainder of demand. c) Out of 1-6, which plan is the best and why? Px • 13.3 The president of Hill Enterprises, Terri Hill, projects the firm's aggregate demand requirements over the next 8 months as follows: Jan. 1,400 May 2,200 Feb. 1,600 June 2,200 Mar. 1,800 1,800 July Apr. 1,800 1,800 Aug ...

(Solved): 138. What does a force field analysis do?Select one:a. Provi...

138. What does a force field analysis do?

Select one:

a. Provide analysis of all the interactions outside the upperand lower limits

b. Lets teams understand how factors surrounding a process mightdrive or restrain change.

c. Identifies road blocks to completing statistical analysis inthe field.

d. Identifies contractor resources available to work on theproject.

139. Nonparametrics contains which type of data?

Select one:

a. Normally distributed data

b. All data

c. Discrete data

d. Non-normally distributed continuous data

140. Which tool lets the team list and group a large number ofIdeas quickly and systematically?

Select one:

a. Affinity diagram

b. A Venn diagram

c. Fishbone Diagram

d. DMAIC Diagram

141. What types of experiments are typically most commonly usedby six sigma experts?

Select one:

a. None of the Above

b. Multi-Level Factor Experiments

c. Single Factor Experiments

d. 2K factorial experiments

142. When creating a Responsibility chart, what does RACI referto in the charting process?

Select one:

a. Responsible, Accountable, Consult, Inform

b. Responsible, Administrative, Consult, Inform

c. Responsible, Administrative, Consulting, Impartial

d. Responsible, Acquired, Control, Inform

143. What are two types of basic process maps?

Select one:

a. Plot graph and SIPOC diagram

b. SIPOC Diagram and Venn Diagram

c. Pie chart and venn diagram

d. Flowcharts and swimlane process map

144. Statistics do not lie, but mathematics cannot evaluatewhat?

Select one:

a. Non-numerical priorities

b. Prepared priorities

c. Numeric and non-numeric priorities

d. Numerical priority

(Solved): 13.2.6 Strengths of DCHS’ Logistic ServicesAlthough DCHS h...

13.2.6 Strengths of DCHS’ Logistic Services

Although DCHS has a relatively good base and has developed intoa powerful logistics company in the Pearl River Delta, it has alsofaced some problems. The development of the TPL industry hasincreased competition. DCHS is facing some challenges: how toexpand the business, how to develop new customers, how to maintainlong-term cooperative relationships with old customers, how to facethe pressure from competitors in price and services. These concernspushed DCHS into changing from a simple logistic provider to a TPLprovider. DCHS’s logistics team pays much more attention to thevalue-added services the company can provide, considering it to beone of the company’s competitive strengths.

Value-added services in the import bondedwarehouse

The products inside a bonded warehouse are equivalent to thoseoutside of China: they do not need to go through the importprocedure, and thus do not have to pay import duty, they do notneed to go through the export procedure when they are laterexported. During the period between import and export, the lawpermits the carrying out of many value-added services in the bondedwarehouses. Additionally, the cost for the rent of the warehouse inChina is much lower than that in other developed countries. Thefollowing example illustrates this situation.

Dongfang shoe factory in Dongguan exported a batch of sportshoes to Germany in June, 2006. Due to a slight defect inappearance (some tiny grey plastic particles stuck on the bottom ofthe shoe soles) they were regarded as unsuitable when the shoesarrived in Germany. The factory faced two choices: one was toentrust a local factory for second processing but the processingcost was too expensive and surpassed the commodity value. The otherwas to go back to China, but it would then have to go through theimport and export process again. At that time, the shoes had beenreturned to Hong Kong with a storage cost of 500,000 yuan permonth. The factory owner, Mr Xu, saw an advertisement about Sims ina harbor of Hong Kong and contacted the company for help. DCHSfirst transported the shoes to the bonded warehouse, which onlycosts 80,000 Yuan per month to rent, then organized workers toclean out the shoes and had them repackaged. Mr Xu soon foundanother customer and sold them to France. DCHS’s successfulsolution was based on its advantage of an imported bonded warehouseand value-added services, and solved the customer’s problem.

Logistic network design service based on import bondedwarehouse

Brown and Haley sells candies under the brand name Almond Roca,and it is very popular in China and Southeast Asia. Sims tradinghas been Almond Roca’s trade agent for over 10 years in the Asiamarket.

Before 2005, Almond Roca was only imported from the USA. Theprice was expensive and the product was only packaged in two sizes.The lack of variety in the packaging and the high price soon ledcustomers to turn to other brands. In recent years, the marketshare of Almond Roca has declined slightly. Faced with thisproblem, Sims and Brown and Haley thought to change the situationby redesigning the logistic network to offer a better service.Aware of the difficulties experienced by Brown and Haley, Simstrading introduced DCHS to them.

The original logistic network of Almond Roca was so organized:the Almond Roca factory in the USA collected the sweet materialfrom the USA producers and the packing material from papermanufactured in Zhongshan and Dongguan of China then shipped itthrough the ShenZhen Yantian Port. For the Asia market, the finalpacked candies were shipped to Sims Trading in Hong Kong, who werein charge of selling the Almond Roca for China and all theSoutheast Asia Market.

After considerable investigation and preparation, the DCHS teamdesigned a new logistics network. In the new design, instead ofpacking the Roca in the US factory, the candies are shipped in bulkto the bonded DCHS warehouse, as well as the packaging materials.The packing is conducted in the imported bonded warehouse, andwithout any complicated import and export procedures, the finishedproducts are sold to Southeast Asia. Customs clearance is onlynecessary for goods sold in China (Figure 13.4). DCHS providesservices of shipment, packing and quality controls for the entireoperation. Because DCHS installed an advanced computerizedinventory management system, Brown and Haley can log in to thesystem and monitor its Roca inventory. As the best temperature tostore candies is 20°C, DCHS, through GPS, cautiously and carefullymonitor all the storage, packing and transport processes to assureAlmond Roca’s quality.

This cooperation started in June, 2005 and by the end of 2006,both partners were satisfied with the relationship. The customerresponse time for Roca from buying materials to sales isone-quarter of the original. The price has decreased due to savedCustoms clearance and the reduced logistics costs. DCHS is alsohelping Brown and Haley to choose qualified and low-cost packingcompanies in China.

Logistic network design service based on export bondedwarehouse

This is a further example of how DCHS takes advantage of itsbonded warehouse to provide network design for its customers, whichdemands a higher level of cooperation with each party involved inthe network.

La Cafetière is a famous producer of coffee pots and offers anexcellent price/value relationship, targeting the middle to highend of the coffee-maker market. It already sells its products allover the world with two distribution centers, one in the UK and onein the USA, to serve its major markets in Europe and the USA, thatin total account for some 60-70 per cent of sales. La Cafetièrealso sells in Asia where there is a considerable market growthrate.

La Cafetière’s distribution center is located in Greenfield,north Wales. It operates six days a week, 24 hours a day. Demandfluctuates and results in variation of working loads in the center.This challenge is well managed, but the biggest challenge comesfrom the outsourcing of products. Products are manufactured inAsia. This enables La Cafetière to satisfy the market with decentmargins; however, the drawback was that the company was forced tomaintain quite a large amount of inventory for each label in thedistribution center due to the long delivery time, usually over 45days. The old logistics flow is shown in Figure 13.5.

La Cafetière designs the coffee pots and sends the design draftsto its Asian manufacturers for production. Each manufacturer isresponsible for a specific type of coffee pot. The manufacturerssend the finished products to the La Cafetière’s distributioncenter in the UK for packing through Shenzhen Yantian port forcustom clearance. In the UK center, all of the goods were repackedby themselves, with or without promotion items, and then exportedto customers around the world, including Asia. Asian manufacturersof La Cafetière are distributed around Pearl River Delta inYangjiang, Zhongshan and Zhuhai.

La Cafetière has one distribution center in the UK, andeverything from the raw materials, packages and coffee-makers,passes through here to the UK to the manufacturers and sale agentslocated across Europe and Asia. Such a network has obviousshortcomings.

It requires a minimum production quantity of 3000 sets ofcoffee-makers, which filled one 40-inch container, otherwise theshipping costs per set are high. However, today’s consumer ordertends to be lower in quantity with more variation.

Demand for the company’s coffee-makers from Southeast Asia wereincreasing at a rapid rate, but cargo needed to be shipped to theUK from China for quality controls and then shipped back to China.Not only the custom clearance procedures were complicated, but alsothe shipping costs were high. If quality controls in the UK foundsome quality problems, the products needed to be shipped back andforth between China and the UK several times.

Last but not least is the long shipping time. The shipping timefrom factory in Guangdong to the center in the UK took one month.The cargo for the Asia market took three months from the order tothe arrival of final products: one month for the factory tomanufacture the goods, one month’s shipment from China to the UKand one month’s shipment from the UK to Asia.

Mr Johnson, the distribution manager, looked at the logisticflow chart after comments from the company CEO: ‘Johnson, consumercomplaints against us have grown – 1256 complaints in 2004, up to3034 this year, especially in the recent three months. Mostcomplaints focus on the late delivery. Can we take any steps tosolve this problem?’

At the HOFEX 2005 exhibition mid-May 2005 Sims Logistics werepromoting their one-stop logistics services. Customers and visitorswere particularly impressed by Sims’ new logistics center inXinhui. This was where Mr Johnson first met with Mr Smith, whichled to the strategic cooperation between DCHS and La Cafetière. MrSmith recommended a new network design, taking advantage of theirbonded warehouse in Xinhui, to Mr Johnson.

After several months of analysis and discussion between themanagers of DCHS and La Cafetière, they came up with a newlogistics network solution (shown in Figure 13.6). All the coffeepots and packing materials from the supplier are sent to DCHS’sexport bonded warehouse. Within the bonded warehouse, DCHS willpack them, conduct quality controls and provide cargo consolidationservices. As a result, DCHS not only replaced the main functionsoriginally provided by the distribution center in the UK, but savedLa Cafetière from expanding its present warehouse. The finishedproducts are sent to the Nansha port or Hong Kong port depending onthe cost, and from there sent to Asia, Europe or the center in theUK. DCHS owns very advanced inventory management (SLS) software,through which the British company is able to monitor theirinventory any time.

Such a design brings many benefits to La Cafetière. All of themanufacturers are near the DCHS warehouse. Time is saved in theshipment. If quality problems occur, the goods can be returnedquickly from DCHS before they are shipped overseas. Secondly, laborcost of China is much lower than that in the UK. Thirdly, all theproducts that were originally sent separately by each factory tothe distribution center in the UK can be aggregated into fullcontainers and sent to the market directly. The shipping costs arereduced dramatically.

In early 2006 La Cafetière and DCHS signed a contract andstarted the logistics cooperation. The results show that DCHSlogistics’ design successfully solved La Cafetière’s warehouseproblem, and reduced La Cafetière’s shipment costs.

1. What are the strengths and weaknesses ofDCHS?

(Solved): 14-20 Is the consumer marketing approach taken by "Live Tes...


14-20 Is the consumer marketing approach taken by Live Tests appropriate for all B-to-B marketers? Explain.
14-20 Is the consumer marketing approach taken by "Live Tests" appropriate for all B-to-B marketers? Explain.

(Solved): 14.1. List the 4 fundamental components of the marketing mix...

14.

1. List the 4 fundamental components of the marketing mix.

2. Define each component of the marketing mix.

3. Provide an example of how a business would use each one.

We Provide Services Across The Globe