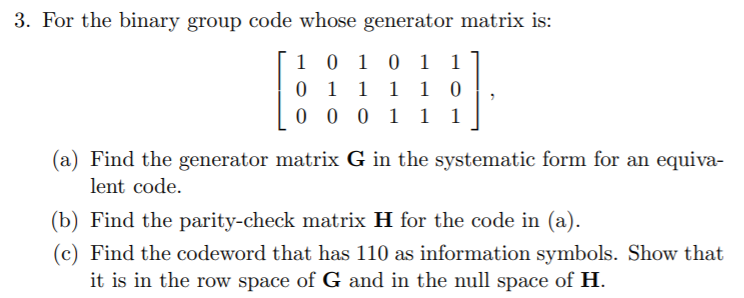
Short-run equilibrium and long-run aggregate supply
The following graph shows several aggregate demand and aggregate supply curves for an economy whose potential output is
$5 trillion. The curves are labeled
a,b,c, and d . Three points on the graph are also indicated by grey stars and labeled
K,L, and M .
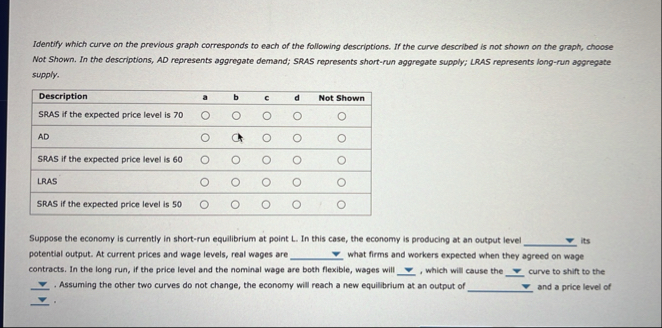
_(_())_(_())Identify which curve on the previous graph corresponds to each of the following descriptions. If the curve described is not shown on the graph, choose Not Shown. In the descriptions, AD represents aggregate demand; SRAS represents short-run aggregate supply; LRAS represents long-run aggregate supply.
\table[[Description,a,b,c,d,Not Shown],[SRAS if the expected price level is 70,
?,
?,
?,
?,
?